Published: 4 Sep 2026 · Last verified: 5 Sep 2026 · Next review: Dec 2026 Cost figures are re-checked against permit records quarterly. Changes are logged in Corrections.
Build cost without rent is only half a decision. Rent without build cost is a fantasy.
This post puts the series 800 sq ft detached ADU at $320,000 — and the ~$381,000 all-in year-one stack — next to realistic Los Angeles County ADU rent ranges and runs the simple math: gross payback years, cash-on-cash on an equity check, and the variables that quietly wreck the spreadsheet.
This is not financial, tax, or investment advice. It is a line-item planning model so you can see which assumptions matter. Your rents, rates, taxes, and risk tolerance are yours. Talk to a licensed financial and tax professional before you borrow or build.
The short answer
| 800 sq ft ADU · LA County planning model · 2026 | Figure |
|---|---|
| Construction (series baseline) | $320,000 |
| All-in year-one (self-managed, from all-in post) | ~$381,000 |
| Modeled rent mid | $3,200 / mo ($38,400 / yr gross) |
| Rent range used for stress tests | $2,600–$3,800 / mo |
| Simple payback on construction @ mid rent (gross) | ~8.3 years |
| Simple payback on all-in @ mid rent (gross) | ~9.9 years |
| Simple payback on all-in @ mid rent (after 5% vacancy + tax + light OpEx) | ~13–15 years |
| Cash-on-cash (illustrative 25% equity on all-in) | High single digits to low teens % depending on rent and financing — see tables |
If someone promises a “5-year payback” on a full $320k+ California ADU without showing vacancy, tax, and debt service, ask which line items they deleted.
Cost basis — two numbers, use both
| Basis | Amount | Use for |
|---|---|---|
| Construction only | $320,000 | Comparing contractor bids; series consistency |
| All-in year-one (self-managed) | ~$381,000 | Honest owner capital including contingency, interest, year-1 tax, lease-up vacancy |
Details of the all-in stack — 12% contingency, modeled loan interest, Prop 13 ADU-only tax, vacancy — are in the all-in cost post. Soft costs are already inside the $320k (soft costs breakdown).
Rent ranges (LA County, mid-grade 800 sq ft)
| Scenario | Monthly rent | Annual gross |
|---|---|---|
| Low | $2,600 | $31,200 |
| Mid (model) | $3,200 | $38,400 |
| High | $3,800 | $45,600 |
These are planning bands for a legal, mid-grade detached ADU in Los Angeles County in 2026 — roughly a generous one-bed or compact two-bed depending on plan. Coastal ZIPs and new luxury finishes can clear the high end; weaker locations, awkward conversions, and oversupplied pockets sit at the low end. Pull comps within a mile of your parcel before you believe any row.
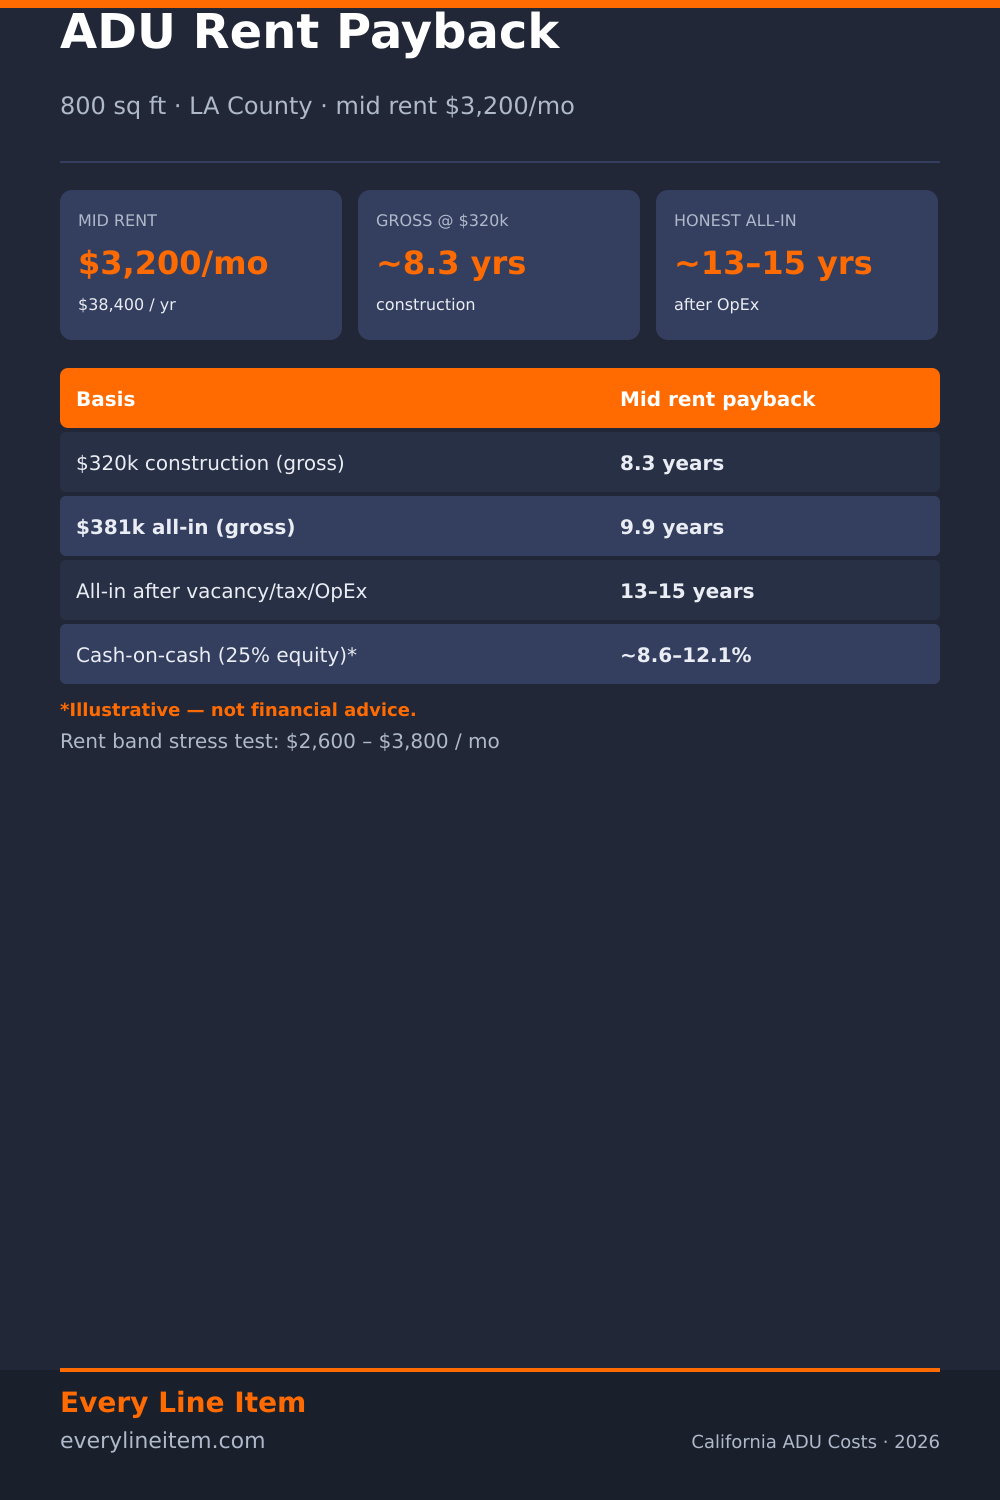
Pin this breakdown: right-click / long-press the image, or use the Pinterest share button.
Simple payback (gross rent ÷ cost)
Gross payback ignores vacancy, tax, insurance, maintenance, management, and debt service. It is a first filter, not a return.
| Cost basis | Low rent ($2,600) | Mid ($3,200) | High ($3,800) |
|---|---|---|---|
| $320,000 construction | 10.3 yrs | 8.3 yrs | 7.0 yrs |
| $381,000 all-in | 12.2 yrs | 9.9 yrs | 8.4 yrs |
Takeaway: moving from construction-only math to all-in math adds roughly 1.5–2 years of payback at the same rent. Moving from mid to low rent adds more than that.
Operating snapshot (mid rent)
Illustrative stabilized year after lease-up — still not advice:
| Line | Annual | Notes |
|---|---|---|
| Gross rent | $38,400 | $3,200 × 12 |
| Vacancy / credit loss @ 5% | −$1,920 | Separate from year-1 lease-up vacancy already in all-in |
| Effective gross | $36,480 | |
| Property tax (ADU improvement only, modeled) | −$3,300 | From all-in post; main house base untouched |
| Insurance (ADU share, modeled) | −$1,200 | Highly variable |
| Maintenance / reserves @ 5% of gross | −$1,920 | Understates big repairs |
| Management (optional) @ 9% of collected | $0 or −$3,280 | Self-manage vs manage |
| NOI — self-managed | ~$30,060 | Before debt service |
| NOI — with management | ~$26,780 | Before debt service |
Payback on NOI (approximate)
| Cost basis | Self-managed NOI | Payback | Managed NOI | Payback |
|---|---|---|---|---|
| $320,000 | ~$30,100 | ~10.6 yrs | ~$26,800 | ~11.9 yrs |
| $381,000 | ~$30,100 | ~12.7 yrs | ~$26,800 | ~14.2 yrs |
Once you stop dividing by gross rent, “about eight years” becomes “about thirteen to fourteen” on an honest all-in basis with mid assumptions. That is still a usable long-term hold for many owners — it is not a get-rich-quick flyer.
Cash-on-cash (illustrative)
Assume you fund 25% equity on the $381,000 all-in basis and finance the rest. Equity check ≈ $95,250.
Permanent loan terms vary wildly in 2026; this table uses a simple interest-only placeholder at 6.5% on a $285,750 loan balance so debt service is visible — not a product recommendation.
| Self-managed | With management | |
|---|---|---|
| NOI | ~$30,060 | ~$26,780 |
| Annual debt service (I/O @ 6.5%) | −$18,574 | −$18,574 |
| Cash flow before tax | ~$11,490 | ~$8,210 |
| Cash-on-cash on $95,250 equity | ~12.1% | ~8.6% |
Switch the loan to amortizing principal-and-interest and cash flow drops. Raise the rate and it drops faster. Cut rent to $2,600 and, with management, cash flow can approach thin or negative depending on leverage — which is the point of the stress tests below.
Family occupancy and non-rent use cases do not produce cash-on-cash. They produce housing utility. Do not force an ROI frame onto a caregiver unit unless you truly intend to measure it that way.
What breaks the model
| Breaker | How it shows up | What to do in the spreadsheet |
|---|---|---|
| Vacancy | 3 months empty; bad tenant turnover | Run 8–10% vacancy, not 0% |
| Rate | Construction or perm rate +150 bps | Rebuild debt service; watch cash-on-cash collapse |
| Management | You thought you would self-manage and then do not | Put 8–10% in from day one as a case |
| Overbuild | Coastal / custom costs at $475+/sq ft with inland rents | Pair with coastal vs inland |
| Under-rent | Awkward plan, no parking, noisy lot | Use low-rent column, not mid |
| Ignored all-in | Payback sold on $320k while you spend $380k+ | Always show both bases |
| Regulation / HOA | Rental bans, licensing, insurance shocks | Not in these tables — underwrite locally |
400 sq ft and garage conversion (quick)
| Path | Construction | Rough mid rent | Gross payback on construction |
|---|---|---|---|
| 800 detached | $320,000 | $3,200 | ~8.3 yrs |
| 400 detached | $215,000 | $2,400 | ~7.5 yrs |
| Garage conversion | $190,000 | $2,200–$2,600 | ~6–7+ yrs |
Smaller units can show faster gross payback because absolute cost falls more than rent falls — until vacancy and fixed OpEx eat the thinner NOI. Run all-in math before celebrating a “shorter payback” on 400 feet.
Strong disclaimer (read it)
This article is for educational construction-cost and planning context only. It is not financial advice, investment advice, tax advice, legal advice, or a lending offer. Figures are modeled medians and illustrations. Rents, interest rates, occupancy, taxes, insurance, construction costs, and regulations change. Past or modeled performance does not predict your results. Do not build, buy, or borrow based solely on these tables. Consult licensed California professionals: contractor, architect, CPA/tax advisor, and a fiduciary financial advisor as appropriate.
Put your own quote in these six rows
We made a blank version of the six-phase ledger. Drop your contractor’s numbers into it and see which line doesn’t match ours.
Download the worksheet — CSV (import to Google Sheets), no email required
Want the regional benchmark ranges for each phase, updated quarterly?
Methodology and sources
Every figure on this page is a modeled median, not a quote. Here is exactly how it was built, so you can check it or reproduce it yourself.
| Input | Source |
|---|---|
| Statewide ADU rules, size limits, and fee exemptions | California HCD ADU Handbook |
| 2026 changes to State ADU Law | HCD Addendum, December 2025 |
| Declared construction valuations, unincorporated LA County | EPIC-LA permit portal |
| Declared construction valuations, City of Los Angeles | LADBS Permit & Inspection Report |
| Permit record dataset | LA County Open Data — EPIC-LA Permit Finder |
| Phase-level cost shares for residential construction | NAHB Cost of Construction Survey |
| Per-square-foot construction price benchmarks | NAHB Survey of Construction |
| Regulatory share of finished build cost | NAHB regulatory cost study, June 2026 |
| Zoning and parcel constraints | ZIMAS |
Check this number against your own address
Most California jurisdictions publish permit records online, including the declared construction valuation for each project. That declared valuation is the closest thing to a real local baseline you can get without paying anyone.
- Open EPIC-LA for unincorporated LA County, or the LADBS Permit & Inspection Report for addresses inside the City of Los Angeles.
- Search recent ADU permits within about a mile of your address.
- Compare the declared valuation to the phase totals on this page.
Declared valuations run below contract price — treat them as a floor, not a total. Full detail on Methodology.
If your local numbers diverge meaningfully from ours, we want to know. See Corrections.
Our position
We don’t build ADUs. We don’t sell plans. We don’t sell your information to contractors. No figure on this site has been paid for or reviewed by anyone whose costs we publish. More on About.
Figures are Los Angeles County, 2026, stated as medians of contractor ranges. Costs vary by jurisdiction, site access, and finish level. This is construction cost information — not a quote, and not legal, engineering, or financial advice. Confirm requirements with your local building department and a licensed California contractor.
Frequently asked questions
How long does an ADU take to pay back in California?
On this 800 sq ft model, gross payback on construction at mid rent is about 8–9 years; on all-in cost about 10 years. After vacancy, tax, and light OpEx, roughly 13–15 years is a more honest mid case. Your number will differ.
What rent should I assume for an 800 sq ft ADU in LA County?
Start with comps, not blogs. This post uses $2,600–$3,800 / month as a stress band and $3,200 as the mid case for a mid-grade unit.
Is cash-on-cash the same as ROI?
No. Cash-on-cash is annual pre-tax cash flow divided by cash equity. Full ROI includes appreciation, amortization, tax effects, and sale — none of which this post claims to forecast.
Does Prop 13 kill ADU returns?
It adds tax on the new construction only. It does not reassess your whole house. Model the ADU tax line; do not invent a full-home reset.
Should I build for ROI or for family housing?
Different objectives. This post measures rent. If the unit is for a parent or caregiver, optimize for suitability and total cost — and read the hard-cost posts — rather than forcing a cash-on-cash target.